




Part ofClaude AI Features: The Complete Overview
Claude for data analysis turns a raw CSV or Excel upload into summaries, trends, and charts. The workflow, a use-case table, the real limits, and how to verify.
In This Article
7 sectionsClaude for data analysis means uploading a CSV or Excel file and asking questions in plain English. Claude reads the rows, summarizes them, spots trends, and runs its built-in analysis tool (a JavaScript sandbox) to compute exact figures and draw charts. It handles files up to 30 MB and shows its work, so you can verify every number.
We run the numbers behind this site in Claude every week — subscriber growth, ad revenue, which posts actually convert — so we have pushed Claude for data analysis well past the tidy demo spreadsheet. Below is the workflow we use, the jobs it handles best, a use-case table, the limits that trip people up, and the one habit that keeps its output trustworthy: verify before you ship. It pairs closely with our Claude in Excel guide — this piece is the general-purpose companion to that spreadsheet-specific one.
What Claude for data analysis actually does
Two engines sit under the hood, and knowing which one is running explains most of what you see. The first is plain reasoning: Claude reads your uploaded file as context and answers questions about it the way it reads any document. The second is Anthropic's built-in analysis tool, a JavaScript sandbox where Claude writes and runs real code to crunch the data, then reports what the code returned. When a question needs genuine arithmetic — a sum, an average, a correlation, a pivot across 40,000 rows — the analysis tool computes it deterministically instead of the model estimating in its head.
That split is exactly why Claude for data analysis is reliable on the hard maths and shaky on the deceptively simple stuff. Ask for a headline total and Claude may answer from reasoning and land a few percent off; tell it to "use the analysis tool to calculate," and it runs inspectable code. And while Claude cannot generate images from a text prompt, it draws real charts by writing plotting code and rendering the result — a different mechanism, with far more accuracy behind it.
The Claude for data analysis workflow, step by step
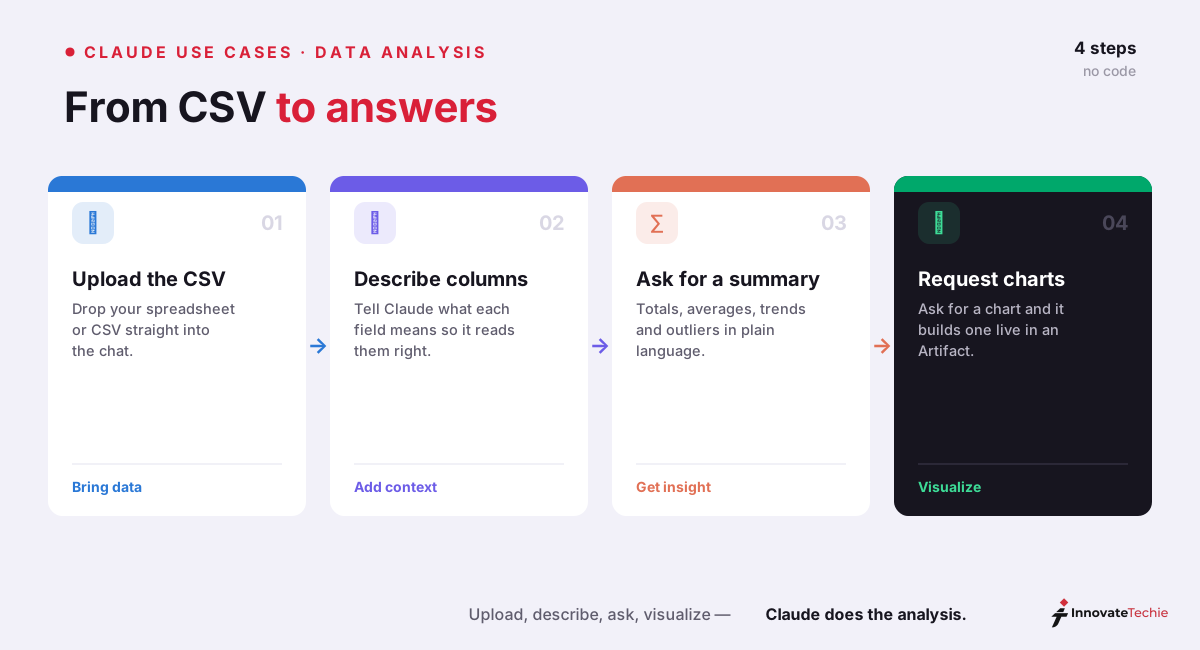
Every good analysis session we run follows the same six-step shape. Rushing straight to "what does this mean?" without step two is the single biggest cause of wrong answers.
- Upload the file. Click the paperclip and attach your CSV, Excel, JSON, or PDF. This is the starting move for any Claude CSV analysis — the cleaner the file, the better the read.
- Describe the data. Tell Claude what a row represents and what the key columns mean. One sentence of context ("each row is one order;
ltvis lifetime value in USD") prevents most misreads. - Ask for a summary first. Open with "summarize this dataset — shape, columns, and anything odd." It surfaces missing values and outliers before you build on bad data.
- Drill into questions. Now analyze data with Claude conversationally: trends, segments, rankings, correlations. Each follow-up builds on the last without re-uploading.
- Ask for a chart or an interactive view. Request a plot, or push it into an Artifact for a dashboard you can click through.
- Verify. Ask Claude to show the code it ran, or recompute a number a second way. Treat every figure as a first draft until you have seen the working.
What you can analyze with Claude: a use-case table
The requests below cover most of what people actually reach for. We map each job to a plain-English prompt and what Claude does behind it — a quick menu for anyone new to Claude data analysis. These are the everyday jobs where Claude for data analysis quietly saves an afternoon.
| Task | Example prompt | What Claude does |
|---|---|---|
| Summarize a dataset | "Give me a 5-bullet summary of this sales export." | Reads the file and describes shape, columns, and headline stats |
| Find trends | "Which month grew fastest, and by how much?" | Runs the analysis tool to compute period-over-period change |
| Segment the data | "Break revenue down by region and rank them." | Groups, aggregates, and returns a sorted table |
| Clean messy data | "Standardize these dates and flag duplicates." | Reformats, dedupes, and lists the rows it changed |
| Build a chart | "Plot monthly signups as a line chart." | Writes plotting code and renders the chart inline |
| Write reusable code | "Give me the pandas script that produces this." | Outputs a script you can rerun on next month's file |
Claude is not picky about formats. It reads CSV, Excel, JSON, PDF, DOCX, and plain text, and it can also create and edit files — handing back a finished .xlsx or a written report rather than just an answer in the chat.
| Format | Good for | Notes |
|---|---|---|
| CSV | Raw tabular data, largest row counts | Fewest tokens; convert Excel to CSV for big files |
| Excel (XLSX) | Multi-tab workbooks, formatted models | Read directly; formulas and formatting cost tokens |
| JSON | Nested records, API exports | Claude flattens the structure before analysis |
| Reports with tables inside a document | Text and tables extracted; scanned PDFs are weaker | |
| TXT / DOCX | Notes, logs, unstructured text | Good for qualitative passes, not heavy math |
Cleaning messy data and writing analysis code
Real files are messy, and this is where Claude earns its keep. Point it at a column of inconsistent dates, mixed currencies, or stray duplicates and ask it to standardize — it reformats, dedupes, fixes data types, and, crucially, lists the rows it changed so nothing happens silently. This unglamorous cleanup is the core of most Claude CSV analysis, and it is faster than writing the regex yourself.
For anything you will repeat, ask for the code. Claude writes the pandas or SQL that produces a result, and you rerun that script on next month's file untouched. This is also the cleanest fix for accuracy: chat can be confidently wrong on dirty data, but a deterministic script cannot. Running the same analysis inside Claude Code — Anthropic's terminal agent — sidesteps the guesswork entirely, because every number traces to a line of code you can read and rerun.
Charts, Artifacts, and interactive views
Numbers convince nobody; a chart does. Because the analysis tool can run plotting code, Claude turns a column into a histogram, a scatter plot, a box plot, a line chart, or a correlation heatmap on request. For anything you want to poke at rather than just look at, ask Claude to build it as an Artifact — a live side-panel view where a filterable table or an interactive dashboard renders next to the chat and updates as you refine it.
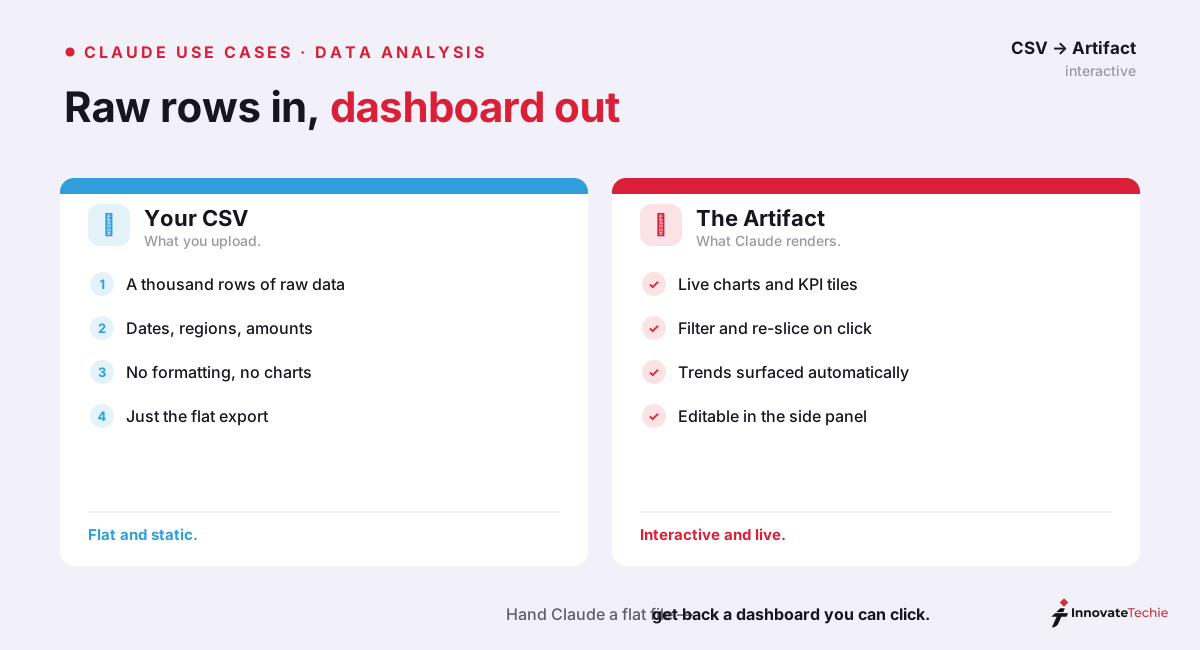
This is where Claude for analytics starts to feel less like a chatbot and more like a junior analyst — one that also explains its reasoning when you ask it to justify a chart or a claim.
Limits: file size, rows, and verifying results
None of this is magic, and pretending otherwise is how people ship a bad number. Claude for data analysis has three hard edges worth respecting, plus one habit that neutralizes all of them.
| Constraint | Practical limit | Workaround |
|---|---|---|
| File size (chat) | 30 MB per file, 20 files per chat | Split the file, or filter columns first |
| Rows in one pass | ~50,000–70,000 within the context window | Sample, pre-aggregate, or use Claude Code |
| Context window | 200K tokens on current models | Summarize in parts, keep data in a Project |
| Accuracy on dirty data | Chat can be confidently wrong | Ask it to run code and show the working |
The upload limit caps chat files at 30 MB, and a spreadsheet with hundreds of thousands of rows will overflow the context window long before that. The workaround is the same each time: filter to the columns you need, pre-aggregate, or move the job to Claude Code, which reads the file from disk instead of stuffing it into the conversation. And whatever the size, the last step never changes — verify. Ask to see the code, spot-check one figure by hand, and only then trust the summary.
Used with those guardrails, Claude for data analysis compresses the slow parts of analysis — the summarizing, the cleaning, the first-pass charts — while leaving the judgment to you. It sits alongside the rest of the Claude AI features we lean on, from the Excel add-in to pulling a transcript out of a video, and it is the fastest way we know to turn a raw export into an answer you can defend.
According to Anthropic's documentation, Claude reads CSV and Excel uploads directly, and in our own runs Claude Opus 4.8 cleaned and summarized a 5,000-row export in a single pass.
Claude pricing at a glance
| Plan | Price |
|---|---|
| Free | $0 |
| Pro | $20 / month |
| Max | from $100 / month |
| API | Pay per token |
For the full breakdown of every plan, see our how much Claude costs guide.
Frequently Asked Questions

Written by
InnovateTechie
Writing about Claude and the Anthropic toolkit — models, Claude Code, pricing, features, and fixes, in clear, practical, hands-on guides tested by daily use.
View all posts →